Pricing the Paradox: CHCT and the Anatomy of a Mispriced Small-Cap REIT
Disclaimer: This is a research write-up for educational purposes. It is not investment advice. Numbers referenced are taken from the attached CHCT one-page model and the accompanying research note.
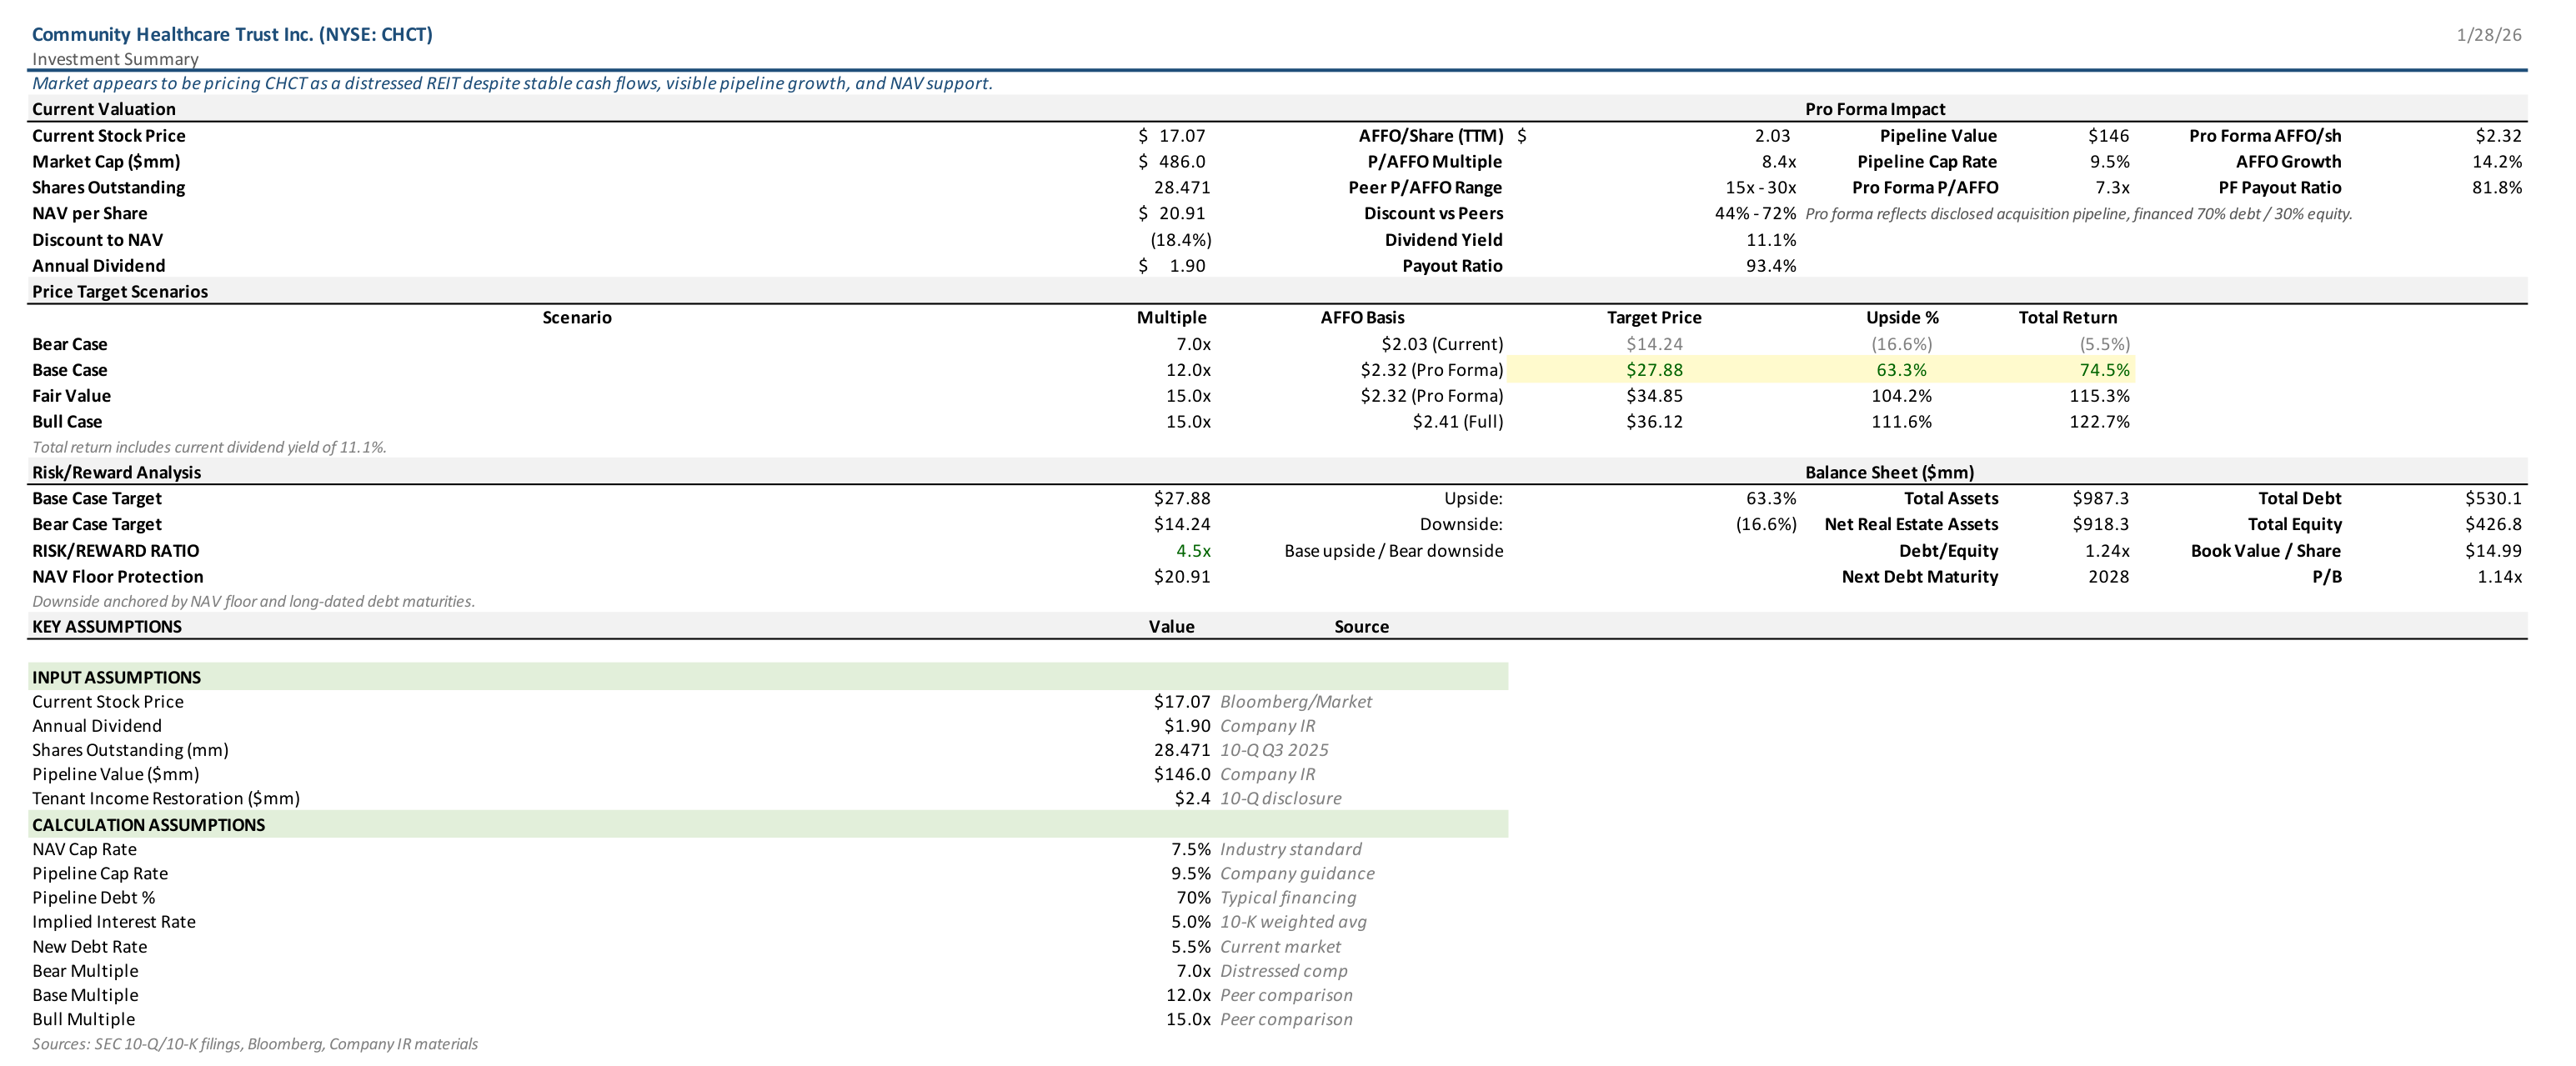
Source: Company filings (10-K, 10-Q), earnings releases, investor presentations, and Bloomberg. All figures reflect latest available TTM financials as of January 2026. AFFO is company-reported. NAV is estimated using a 7.5% cap rate applied to stabilized NOI. Pro forma AFFO incorporates the disclosed acquisition pipeline, assumed 70% debt / 30% equity financing, and current market interest rates. Valuation scenarios are illustrative and based on peer trading multiples.
A stock yielding over 11% is rarely a sign of safety. In capital markets, yields this high on equities (especially on real estate investment trusts) are usually reserved for troubled businesses. Historically, when a REIT trades at this kind of yield and a deep discount to net asset value, it's a warning sign that investors are bracing for a cut to the dividend, a deterioration in cash flows, a major refinancing cliff, or a potential slow-motion collapse. In most such cases, the low price reflects some combination of urgent balance sheet risks, perceived asset quality problems, or skepticism around the sustainability of current earnings. However, Community Healthcare Trust (CHCT) stands out because it does not conform to these typical failure narratives. The question becomes: is the market justified in treating CHCT as distressed, or is the market making a significant error by mispricing a stable, cash-generating healthcare REIT due to its size, profile, or recent headline noise.
The current valuation tells a clear story about market skepticism. At $17.07 per share, CHCT trades at just 8.4 times trailing AFFO, distributes an 11.1% dividend yield, and is priced at a nearly 20% discount to a conservative NAV estimate of $20.91 per share. These numbers are not subtle: the market is paying $8.40 for each $1.00 of recurring cash earnings, demanding a roughly 12% cash return from a portfolio of outpatient healthcare properties. This is an aggressive hurdle rate for this asset class, which typically offers more stable, service-driven demand than traditional office, retail, or hospitality real estate. Such a high required return implies that investors are baking in significant doubts, specifically, that reported cash flows are overstated or vulnerable, that the dividend is unsustainable, that underlying asset values will drop further as cap rates rise, or that tenant quality and credit issues will soon impair income.
CHCT's portfolio consists of about 200 properties in 36 states, mainly medical office buildings, clinics, and other outpatient facilities. These assets are fundamentally different from general office space or cyclical retail, as they serve persistent patient demand. Healthcare tenants value location and continuity, disruptions are expensive and risk patient retention, which means renewal rates tend to be high and leases relatively sticky. The primary risk factors for CHCT's business, tenant concentration, reimbursement changes, and isolated local oversupply, are typical of the sector, not unique to the company. Unlike more speculative property types, cash flow from outpatient healthcare real estate tends to be durable, especially during periods of economic stress when healthcare usage is relatively non-discretionary.
Yet, despite this business profile, CHCT is valued like a company on the verge of distress. The reason lies in structural and perception-driven issues. As a small-cap REIT with limited institutional ownership, CHCT faces "orphan stock" dynamics, which can suppress its valuation regardless of fundamentals. In addition, the company has struggled with GAAP optics: depreciation and non-cash impairment charges obscure the true cash flow picture, making headline net losses look worse than the reality of cash generation. Finally, previous tenant credit issues have left a lingering sentiment penalty, even after the company has reserved for or worked through these events.
The financial model lays out current and pro forma valuation metrics, highlighting both the bear case and the potential for a rerating. CHCT currently has a market cap of $486 million, roughly 28.5 million shares outstanding, and $2.03 per share in AFFO. The $1.90 dividend represents a 93% payout ratio, high but not uncommon for REITs structured to distribute nearly all recurring earnings. NAV per share of $20.91 is based on a property-level NOI of $84.4 million capitalized at 7.5%, with about $530 million of debt subtracted to arrive at net asset value.
The company's peers trade at 15 to 30 times AFFO, while CHCT trades at a fraction of that, just 8.4x today, dropping to 7.3x on a pro forma basis if its $146 million acquisition pipeline is completed as modeled. The pipeline is expected to be financed with 70% debt at a 5.5% rate, generate a 9.5% cap rate, and add about $0.29 per share in AFFO (from $2.03 to $2.32). The model's scenario analysis is intentionally conservative: the base case assumes a 12x multiple on pro forma earnings, still below the peer range, which would yield a target price of $27.88. The bear case assumes a 7x multiple on current earnings for a downside of $14.24, while the "fair value" and "bull" cases suggest even higher targets if either earnings or multiples surprise to the upside.
A large part of the disconnect between price and fundamentals comes from accounting artifacts. GAAP net income is negative due to large non-cash depreciation and impairment charges, but these do not affect cash available for distribution. When you reconcile net income to FFO and AFFO, CHCT actually generates strong recurring cash flow. Generalist investors who screen on GAAP earnings may miss this entirely, dismissing CHCT as a money-loser, while sector specialists focus on cash metrics and see a different picture. The model's reconciliation shows that, after adjusting for non-cash items, AFFO remains stable and well above the dividend. This difference in perception is not just cosmetic, it is the key driver of mispricing in the current setup.
With a 93% payout ratio, CHCT's current dividend leaves little margin for error. However, REITs are structured to pay out most of their earnings, and high payout ratios are not inherently dangerous as long as AFFO is stable and future investments do not dilute per-share cash flow. The company's pipeline, if executed as planned, lifts AFFO per share to $2.32 and brings the payout ratio down to about 82%, making the dividend safer and more defensible. The bear argument must assert that the pipeline is not real, not financeable, not accretive, or that negative developments elsewhere (such as tenant losses or rising interest expense) will offset any improvement.
It is important to sanity-check the pipeline assumptions. The planned $146 million in acquisitions, at a 9.5% cap rate, will generate $13.87 million in new NOI. With 70% debt financing at 5.5%, the interest cost will be about $5.62 million. The net incremental cash flow of $8.25 million, distributed over 28.5 million shares, explains the projected AFFO growth. The acquisition spread, the difference between acquisition yield and cost of capital, is structurally wide in this model, so unless debt costs spike or equity issuance becomes the dominant funding source, the pipeline should be accretive.
NAV is the most common downside anchor for REITs. The model's $20.91 NAV per share is derived from conservative assumptions. If you reverse-engineer the current market price, holding NOI fixed, the market is pricing the real estate at an implied cap rate of about 8.3% rather than the model's 7.5%. This difference is not trivial, but it is not a disaster scenario either, it reflects the market's current risk premium for small-cap, less-liquid healthcare real estate, not a collapse in asset value. If cap rates stabilize, the discount to NAV can close materially without requiring a return to peer multiples. Conversely, if cap rates continue to rise, NAV will compress further, which is the main macro risk to the thesis.
A typical high-yield trap in the REIT sector is an imminent maturity wall or excessive floating-rate debt. CHCT's next major debt maturity is not until 2028, giving it a cushion against short-term market volatility. The company's $918 million in real estate assets, $530 million in debt, and $427 million in equity are not out of line with peers. The stock trades at a small premium to book value, indicating that the market does not assign a distressed discount to the balance sheet. The real risk is skepticism about ongoing cash flows, not near-term financial distress.
The model's scenario table is conservative, using a 12x multiple as the base case, which is below peers but not heroic. The implied upside to $27.88 per share is over 60%, while the bear case downside to $14.24 is less than 20%. The model does not require a full peer re-rating for the thesis to work. Instead, it only needs the market to stop pricing CHCT as distressed and acknowledge improving fundamentals as the pipeline is executed and coverage improves.
This setup creates a "special situation" dynamic. As AFFO grows and the payout ratio improves, the forward multiple drops further if the price does not adjust, increasing pressure for a rerating. The market can ignore this for a time, but the math compounds. If tenant income is restored as assumed in the model, and if NAV remains reasonably stable, the discount will become increasingly difficult to justify. On the other hand, if small-cap status and limited coverage persist, the market may continue to overlook the story, and investors will simply collect the high yield while waiting for a catalyst.
The thesis is not without risks. The biggest threat is a material move higher in cap rates, which would compress NAV and weaken the argument for downside protection. Financing costs could also rise, particularly if CHCT is forced to fund the pipeline with more equity than modeled, which would dilute per-share earnings. A surprise decline in AFFO, either from lease roll-downs, tenant failures, or rising expenses, could make the current payout unsustainable and validate the market's skepticism. Finally, the possibility that the "orphan discount" is permanent, due to small-cap status, lack of sell-side coverage, or limited liquidity, could mean the stock remains undervalued even if fundamentals improve.
CHCT is trading at $17.07, about 8.4 times trailing AFFO and at just over 80% of conservative NAV, with an 11% dividend yield. The market's pessimism is visible in every metric and scenario. The company is priced as if distress is certain, but the model and business facts suggest a stable, cash-flowing landlord with a pipeline of accretive growth opportunities. If the company executes as planned and the market simply reverts to valuing the business at a discounted but non-distressed multiple, the upside is significant and the downside is limited by recurring cash flows and asset value. The bet is not that CHCT is perfect, but that the market's embedded risk premium and pessimism are too large relative to the actual risks documented in the cash flows, pipeline math, and NAV sensitivity. The thesis is thus not an appeal to optimism, but a claim that the current valuation already reflects a bundle of negative assumptions that are difficult to justify against the factual economics of the business.